python关系图的可视化主要就是用来分析一堆数据中,每一条数据的节点之间的连接关系从而更好的分析出人物或其他场景中存在的关联关系。
这里使用的是networkx的python非标准库来测试效果展示,通过模拟出一组DataFrame数据实现四种关系图可视化。
其余还包含了pandas的数据分析模块以及matplotlib的画图模块。
若是没有安装这三个相关的非标准库使用pip的方式安装一下即可。
pip install pandas -i https://pypi.tuna.tsinghua.edu.cn/simple/
pip install matplotlib -i https://pypi.tuna.tsinghua.edu.cn/simple/
pip install networkx -i https://pypi.tuna.tsinghua.edu.cn/simple/
分别将使用到的python模块导入到我们的代码块中,就可以开始开发了。
# Importing the matplotlib.pyplot module as plt.
import matplotlib.pyplot as plt
# Importing the pandas module and giving it the alias pd.
import pandas as pd
这里为了避免中文乱码的情况,分别对字体和编码进行了统一化的设置处理。
plt.rcParams["font.sans-serif"] = ["SimHei"]
plt.rcParams["axes.unicode_minus"] = False
# Importing the networkx module and giving it the alias nx.
import networkx as nx
这里我们采用了有向图的模式来进行演示,有向图也是在生产过程中最常用的一种可视化模式。
G = nx.DiGraph() # 创建有向图
初始化一个DataFrame数据对象作为关系图生成的数据来源。
data_frame = pd.DataFrame(
    {
        'A': ['1', '2', '3', '4', '5', '6'],
        'B': ['a', 'b', 'c', 'd', 'e', 'f'],
        'C': [1, 2, 3, 4, 5, 6]
    }
)
1、随机分布模型
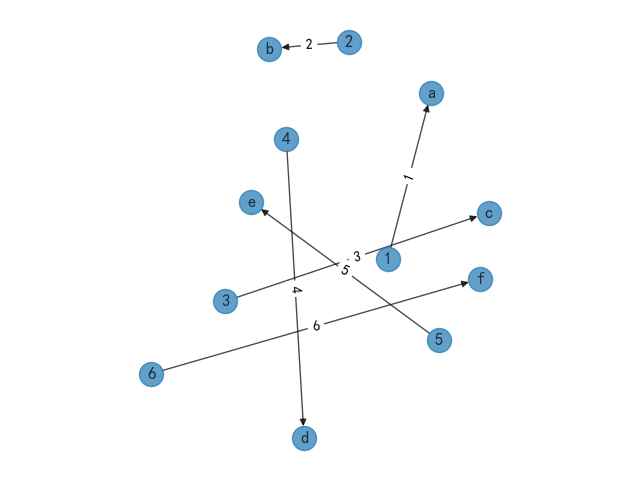
使用随机分布模型的生成规则时,生成的数据节点会采用随机的方式进行展示,生成的数据节点之间相对比较分散更容易观察数据节点之间的关系指向。
for i, row in data_frame.iterrows():
    G.add_edge(row['A'], row['B'], weight=row['C'])
pos = nx.random_layout(G)
nx.draw(G, pos, with_labels=True, alpha=0.7)
labels = nx.get_edge_attributes(G, 'weight')
nx.draw_networkx_edge_labels(G, pos, edge_labels=labels)
plt.axis('equal')
plt.show()
通过matplotlib展示出图形效果如下,并且默认已经添加了数据权重。

2、放射数据模型
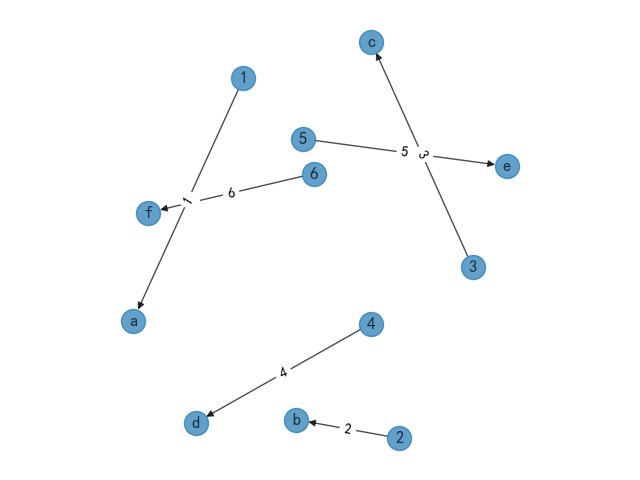
放射状数据模型,顾名思义就是以一个数据节点为中心向周边以发散状的模式进行分布,使用数据节点指向多个节点的可视化展示。
缺点是如果数据不够规范的情况下会展示成一团乱麻的情况,需要经过特殊的可视化处理。
使用方法这里直接将上述随机分布模型的pos模型直接替换成下面的放射状数据模型即可。
pos = nx.spring_layout(G, seed=4000, k=2)

3、其他模型
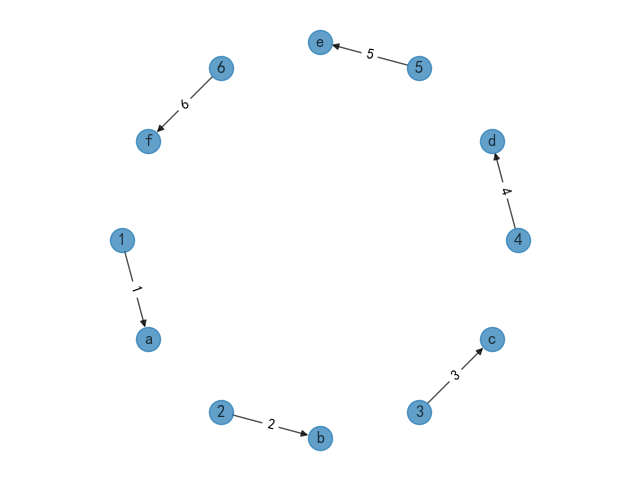
其余两种方式使用同样的方式将随机分布模型中pos模型进行替换即可实现,这里分别展示以下实现效果。
特征值向量模型
pos = nx.spectral_layout(G)

图形边缘化分布模型
pos = nx.shell_layout(G)


